ARTICLES
See how much Led Zeppelin earned on streaming with their songs
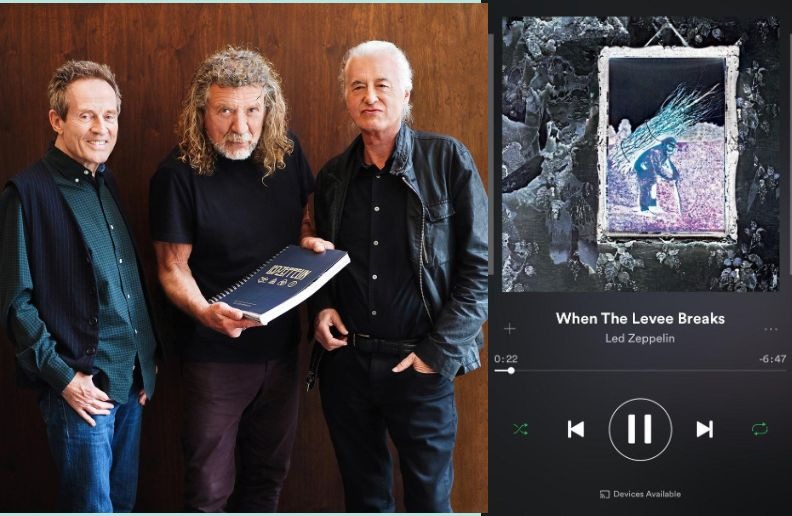
To celebrate the band’s 50-year history and the 75-year anniversary of guitarist Jimmy Page, Billboard decided to make a list that shows Led Zeppelin earnings in 94 songs made available through digital services.
The idea was to rank with the dollars raised by fans who downloaded and / or used streaming services to listen to Led Zeppelin’s songs since the catalog was made available on digital services like iTunes back in 2007.
Unsurprisingly, the numbers are astronomical, and together the songs earned almost $ 22 million dollars.
The song that yielded the least was “Swan Song,” with only $ 241, and the most lucrative sound was “Stairway To Heaven,” which alone grossed nearly $ 3 million dollars.
See the complet list below:
1. “Stairway To Heaven”
Total Revenue: $2,903,223.42
2. “Kashmir”
Total Revenue: $1,421,130.32
3. “Immigrant Song”
Total Revenue: $1,306,140.94
4. “Black Dog”
Total Revenue: $1,167,232.19
5. “Whole Lotta Love”
Total Revenue: $1,034,129.29
6. “Ramble On”
Total Revenue: $888,793.61
7. “Over the Hills And Far Away”
Total Revenue: $757,125.57
8. “Goin’ To California”
Total Revenue: $694,689.56
9. “Rock n’ Roll”
Total Revenue: $636,985.97
10. “D’yer Mak’er”
Total Revenue: $553,459.73
11. “When the Levee Breaks”
Total Revenue: $547,514.60
12. “All My Love”
Total Revenue: $536,716.87
13. “Fool In The Rain”
Total Revenue: $497,152.94
14. “Good Times, Bad Times”
Total Revenue: $484,799.06
15. “Dazed And Confused”
Total Revenue: $443,730.10
16. “Babe, I’m Gonna Leave You”
Total Revenue: $407,165.31
17. “Hey, Hey What Can I Do”
Total Revenue: $383,439.92
18. “The Ocean”
Total Revenue: $356,840.76
19. “Heartbreaker”
Total Revenue: $347,498.72
20. “Misty Mountain Hop”
Total Revenue: $306,642.32
21. “What Is and What Should Never Be”
Total Revenue: $268,812.43
22. “Tangerine”
Total Revenue: $259,820.89
23. “Thank You”
Total Revenue: $258,971.23
24. “Houses Of the Holy”
Total Revenue: $225,027.40
25. “The Rain Song”
Total Revenue: $218,588.41
26. “No Quarter”
Total Revenue: $214,791.48
27. “Ten Years Gone”
Total Revenue: $208,209.71
28. “Since I’ve Been Loving You”
Total Revenue: $203,495.81
29. “Communication Breakdown”
Total Revenue: $192,795.10
30. “Trampled Under Foot”
Total Revenue: $188,227.11
31. “The Battle of Evermore”
Total Revenue: $162,968.95
32. “In The Evening”
Total Revenue: $152,868.76
33. “Dancing Days”
Total Revenue: $152,117.20
34. “Moby Dick”
Total Revenue: $148,890.14
35. “The Song Remains The Same”
Total Revenue: $147,615.69
36. “That’s The Way”
Total Revenue: $145,411.36
37. “Nobody Fault But Mine”
Total Revenue: $145,218.67
38. “Your Time Is Gonna Come”
Total Revenue: $144,974.49
39. “Gallows Pole”
Total Revenue: $138,066.33
40. “The Lemon Song”
Total Revenue: $131,022.38
41. “Bron-Yr-Aur”
Total Revenue: $128,681.08
42. “Out On The Tiles”
Total Revenue: $127,268.99
43. “I Can’t Quit You Baby”
Total Revenue: $121,856.53
44. “How Many More Times”
Total Revenue: $111,449.50
45. “Bron-Yr-Aur Stomp”
Total Revenue: $104,689.97
46. “You Shook Me”
Total Revenue: $98,490.28
47. “Traveling Riverside Blues”
Total Revenue: $91,620.52
48. “Living Loving Maid”
Total Revenue: $83,710.98
49. “The Rover”
Total Revenue: $83,414.79
50. “In The Light”
Total Revenue: $82,704.23
51. “Four Sticks”
Total Revenue: $77,438.31
52. “Custard Pie”
Total Revenue: $76,743.92
53. “The Wanton Song”
Total Revenue: $62,515.55
54. “Bring It On Home”
Total Revenue: $61,961.78
55. “Down By The Seaside”
Total Revenue: $60,087.41
56. “Friends”
Total Revenue: $53,524.44
57. “Hot Dog”
Total Revenue: $53,110.16
58. “Boogie With Stu”
Total Revenue: $51,444.03
59. “The Crunge”
Total Revenue: $49,164.62
60. “Celebration Day”
Total Revenue: $47,008.90
61. “In My Time of Dying”
Total Revenue: $43,020.69
62. “Royal Orleans”
Total Revenue: $42,722.89
63. “Achilles’ Last Stand”
Total Revenue: $34,603.85
64. “Night Flight”
Total Revenue: $31,357.76
65. “Black Country Woman”
Total Revenue: $31,335.44
66. “The Girl I Love”
Total Revenue: $29,136.04
67. “For Your Life”
Total Revenue: $28,755.66
68. “Carouselambra”
Total Revenue: $27,825.52
69. “South Bound Suarez”
Total Revenue: $27,717.06
70. “I’m Gonna Crawl”
Total Revenue: $27,600.51
71. “Hots On For Nowhere”
Total Revenue: $25,801.93
72. “Bonzo’s Montreaux”
Total Revenue: $24,167.02
73. “Black Mountain Side”
Total Revenue: $22,890.85
74. “Sick Again”
Total Revenue: $21,837.55
75. “Hats Off To (Roy) Harper”
Total Revenue: $19,760.24
76. “We’re Gonna Groove”
Total Revenue: $17,953.74
77. “White Summer/Black Mountain Side”
Total Revenue: $16,589.39
78. “Poor Tom”
Total Revenue: $14,161.43
79. “Darlene”
Total Revenue: $13,806.22
80. “Tea For One”
Total Revenue: $12,442.26
81. “Baby Come On Home”
Total Revenue: $12,199.16
82. “Wearing and Tearing”
Total Revenue: $11,756.53
83. “Candy Store Rock”
Total Revenue: $10,465.65
84. “Ozone Baby”
Total Revenue: $9,822.45
85. “Walter’s Walk”
Total Revenue: $8,278.74
86. “Something Else”
Total Revenue: $5,614.45
87. “Sugar Mama”
Total Revenue: $4,663.05
88. “Jennings Farm Blues”
Total Revenue: $4,663.05
89. “La La”
Total Revenue: $4,347.12
90. “Key To the Highway/Trouble In Mind”
Total Revenue: $4,066.19
91. “Sunshine Woman”
Total Revenue: $3,640.77
92. “St. Tristan’s Sword”
Total Revenue: $3,015.62
93. “10 Ribs & All/Carrot Pod Pod”
Total Revenue: $2,268.63
94. “Swan Song”
Total Revenue: $241.20
See more News


